Creating a comfortable dietary life through food tray containers
Financial Highlights
Sales
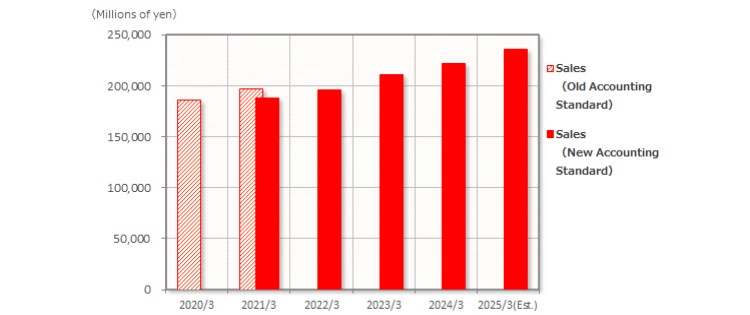
*“ASBJ Statement No. 29 Accounting Standard for Revenue Recognition” was applied from FY2022 ended Mar. 2022.
| Fiscal Year Ending | March 2020 | March 2021 | March 2022 | March 2023 |
March 2024 |
March 2025 (forecast) |
|
|---|---|---|---|---|---|---|---|
|
Sales (Millions of yen) |
186,349 | 196,950 | 195,700 | 211,285 | 222,100 | 236,000 | |
| Product sales | 142,831 | 152,158 | 151,770 | 166,060 | 171,653 | 179,810 | |
| Merchandise sales | 43,518 | 44,791 | 43,929 | 45,225 | 50,446 | 56,190 | |
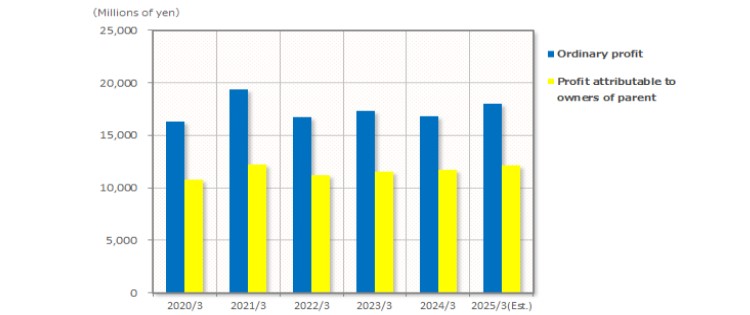
Ordinary profit / Profit attributable to owners of parent
| Last month of fiscal year | March 2020 | March 2021 | March 2022 |
March 2023 |
March 2024 |
March 2025 (forecast) |
|
|---|---|---|---|---|---|---|---|
| Ordinary profit (millions of yen) |
16,274 | 19,381 | 16,703 | 17,328 | 16,780 | 18,000 | |
| Profit attributable to owners of parent (millions of yen) |
10,777 | 12,211 | 11,206 | 11,529 | 11,724 | 12,122 | |
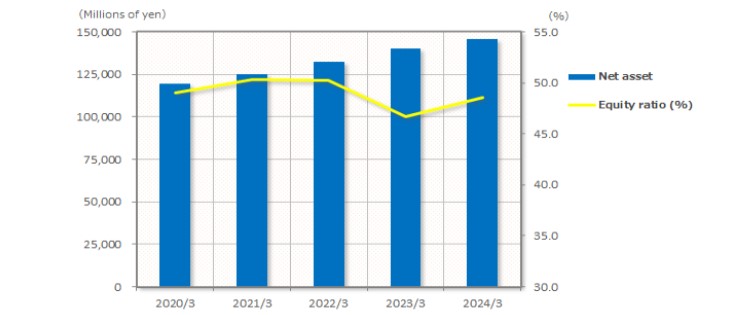
Net assets/Equity ratio
| Last month of fiscal year | March 2020 | March 2021 | March 2022 | March 2023 | March 2024 | |
|---|---|---|---|---|---|---|
| Net asset (millions of yen) |
119,301 | 124,980 | 132,455 | 140,171 | 145,844 | |
| Equity ratio (%) | 49.0 | 50.3 | 50.2 | 46.7 | 48.6 | |
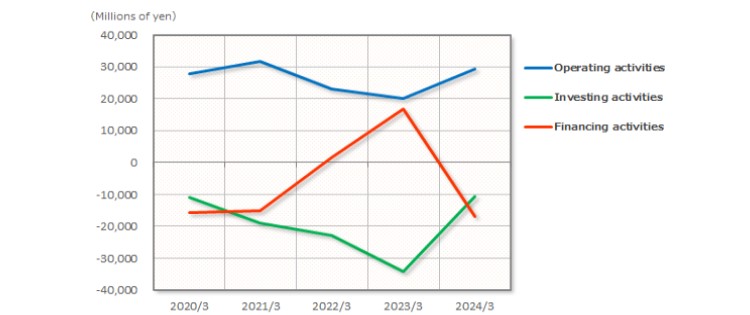
Cash flows
| Last month of fiscal year | March 2020 | March 2021 | March 2022 | March 2023 | March 2024 | |
|---|---|---|---|---|---|---|
| Cash flow from operating activities | 27,770 | 31,814 | 23,148 | 20,071 | 29,176 | |
| Cash flow from investing activities | △10,989 | △19,131 | △22,866 | △34,306 | △10,711 | |
| Cash flow from financing activities | △15,643 | △15,086 | 1,578 | 16,745 | △17,013 | |